 优化
优化
# 5. 优化
对于一个常驻内存的服务端而言,更高的性能以及更低的资源消耗,始终是后端开发人员的追求。同时,更高性能的服务程序,也意味着在处理相同数量访问请求的前提下,使用的机器数量更少,这可是为公司节省真金白银的有效策略。
而且,Go 语言最初设计时就被定位为“系统级编程语言”,这说明高性能也一直是 Go 核心团队的目标之一。很多来自动态类型语言的开发者转到 Go 语言,几乎都有着性能方面的考量。
# 5.1 Go 程序优化的基本套路
Go 程序的优化,也有着固定的套路可循,示意图:

第一步要建立性能基准。要想对程序实施优化,首先要有一个初始“参照物”,这样才能在执行优化措施后,检验优化措施是否有效;
第二步是性能剖析。要想优化程序,首先要找到可能影响程序性能的“瓶颈点”,通过各种工具和方法找到这些“瓶颈点”;
第三步是代码优化。要针对上一步找到的“瓶颈点”进行分析,找出它们成为瓶颈的原因,并有针对性地实施优化;
第四步是与基准比较,确定优化效果。采集优化后的程序的性能数据,与第一步的性能基准进行比较,看执行上述的优化措施后,是否提升了程序的性能。
如果有提升,那就说明这一轮的优化是有效的。如果优化后的性能指标仍然没有达到预期,可以再执行一轮优化,这时就要用新的程序的性能指标作为新的性能基准,作为下一轮性能优化参考。
# 5.2 建立性能基准
建立性能基准的方式大概有两种:
- 第一种是通过编写 Go 原生提供的性能基准测试(benchmark test)用例来实现。这相当于对程序的局部热点建立性能基准,常用于一些算法或数据结构的实现,比如分布式全局唯一 ID 生成算法、树的插入 / 查找等;
- 第二种是基于度量指标为程序建立起图形化的性能基准,这种方式适合针对程序的整体建立性能基准。
自定义协议服务端程序就十分适合用第二种方式。
建立观测设施
使用 Prometheus+Grafana 的组合来为程序建立性能指标观测设施。使用 docker-compose 工具,基于容器安装 Prometheus+Grafana 的组合。
参考 docker 安装教程 (opens new window) 以及 docker-compose 安装教程 (opens new window) 自行在 Linux 上安装这两个工具。
首先,在 Linux 主机上建立一个目录 monitor,这个目录下,创建 docker-compose.yml 文件:
version: "3.2"
services:
  prometheus:
    container_name: prometheus
    image: prom/prometheus:latest
    network_mode: "host"
    volumes:
      - ./conf/tcp-server-prometheus.yml:/etc/prometheus/prometheus.yml
      - /etc/localtime:/etc/localtime
    restart: on-failure

  grafana:
    container_name: grafana
    image: grafana/grafana:latest
    network_mode: "host"
    restart: on-failure
    volumes:
      - /etc/localtime:/etc/localtime
      - ./data/grafana:/var/lib/grafana

  # linux node_exporter
  node_exporter:
    image: quay.io/prometheus/node-exporter:latest
    restart: always
    container_name: node_exporter
    command:
      - '--path.rootfs=/host'
    network_mode: host
    pid: host
    volumes:
      - '/:/host:ro,rslave'
2
3
4
5
6
7
8
9
10
11
12
13
14
15
16
17
18
19
20
21
22
23
24
25
26
27
28
29
30
31
docker-compose.yml 是 docker-compose 工具的配置文件,基于这个配置文件,docker-compose 工具会拉取对应容器镜像文件,并在本地启动对应的容器。
文件中包含了三个工具镜像,分别是 Prometheus、Grafana 与 node-exporter。其中,node-exporter 是 prometheus 开源的主机度量数据的采集工具,通过 node exporter,可以采集到主机的 CPU、内存、磁盘、网络 I/O 等主机运行状态数据。结合这些数据,可以查看应用在运行时的系统资源占用情况。
docker-compose.yml 中 Prometheus 容器挂载的 tcp-server-prometheus.yml 文件放在了 monitor/conf 下面:
global:
  scrape_interval: 5s # Set the scrape interval to every 15 seconds. Default is every 1 minute.
  evaluation_interval: 15s # Evaluate rules every 15 seconds. The default is every 1 minute.
  # scrape_timeout is set to the global default (10s).

# Alertmanager configuration
alerting:
  alertmanagers:
    - static_configs:
        - targets:
          # - alertmanager:9093

# Load rules once and periodically evaluate them according to the global 'evaluation_interval'.
rule_files:
  # - "first_rules.yml"
  # - "second_rules.yml"

# A scrape configuration containing exactly one endpoint to scrape:
# Here it's Prometheus itself.
scrape_configs:
  # The job name is added as a label `job=<job_name>` to any timeseries scraped from this config.
  - job_name: "prometheus"
    # metrics_path defaults to '/metrics'
    # scheme defaults to 'http'.
    static_configs:
      - targets: ["localhost:9090"]

  - job_name: "tcp-server"
    static_configs:
      - targets: ["localhost:8889"]

  - job_name: "node"
    static_configs:
      - targets: ["localhost:9100"]
2
3
4
5
6
7
8
9
10
11
12
13
14
15
16
17
18
19
20
21
22
23
24
25
26
27
28
29
30
31
32
33
34
配置文件的 scrpae_configs 下面,配置了三个采集 job,分别用于采集 Prometheus 自身度量数据、tcp server 的度量数据,以及 node-exporter 的度量数据。
grafana 容器会挂载本地的 data/grafana 路径到容器中,为了避免访问权限带来的问题,在创建 data/grafana 目录后,最好再为这个目录赋予足够的访问权限,比如:
$chmod -R 777 data
运行下面命令,docker-compose 就会自动拉取镜像,并启动 docker-compose.yml 中的三个容器:
$docker-compose -f docker-compose.yml up -d
等待一段时间后,执行 docker ps 命令,能看到以下三个正在运行的容器,安装成功:
$docker ps
CONTAINER ID   IMAGE                                     COMMAND                  CREATED        STATUS        PORTS     NAMES
563d655cdf90   grafana/grafana:latest                    "/run.sh"                26 hours ago   Up 26 hours             grafana
65616d1b6d1a   prom/prometheus:latest                    "/bin/prometheus --c…"   26 hours ago   Up 26 hours             prometheus
b29d3fef8572   quay.io/prometheus/node-exporter:latest   "/bin/node_exporter …"   26 hours ago   Up 26 hours             node_exporter
2
3
4
5
观测设施中各个工具之间的关系:

配置 Grafana
一旦成功启动,Prometheus 便会启动各个采集 job,从 tcp server 以及 node-exporter 中拉取度量数据,并存储在其时序数据库中,这个时候需要对 Grafana 进行一些简单配置,才能让这些数据以图形化的方式展现出来。
首先为 Grafana 配置一个新的数据源(data source),在数据源选择页面,选择 Prometheus:

选择后,在 Prometheus 数据源配置页面,配置这个数据源的 HTTP URL 就可以了。点击“Save & test”按钮后提示成功,数据源就配置好了。
添加 node-exporter 仪表板(dashboard),把从 node-exporter 拉取的度量数据以图形化方式展示出来。可以从 Grafana 官方找到现成的 node-exporter 仪表板,然后在 grafana 的 import 页面中输入相应的 dashboard ID,就可以导入相关仪表板的设置:

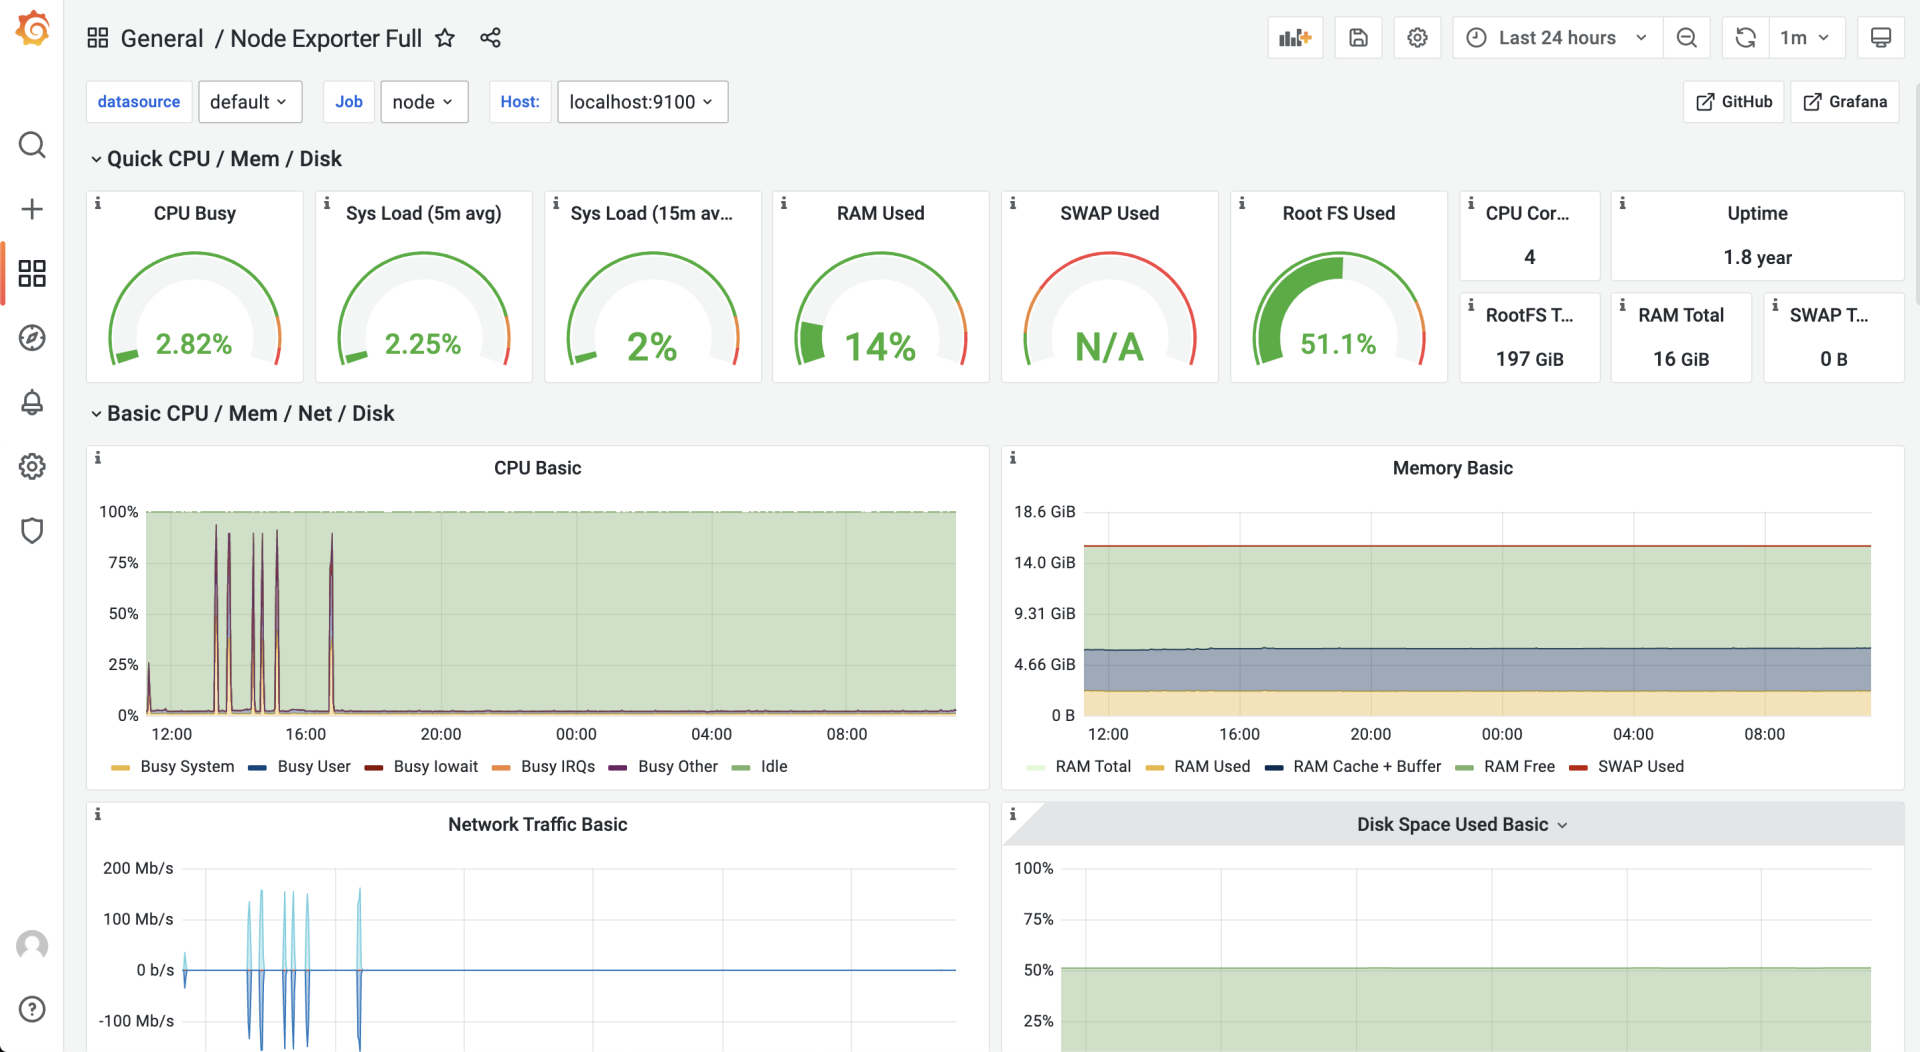
使用的是 ID 为 1860 的 node-exporter 仪表板,导入成功后,进入这个仪表板页面,等待一段时间后,就可以看到类似下面的可视化结果:
在服务端埋入度量数据采集点
定义三个度量数据项来反映服务端的性能指标:
- 当前已连接的客户端数量(client_connected);
- 每秒接收消息请求的数量(req_recv_rate);
- 每秒发送消息响应的数量(rsp_send_rate)。
拷贝 tcp-server-demo1 项目形成 tcp-server-demo2 项目,在 tcp-server-demo2 项目中实现这三个度量数据项的采集。
在 tcp-server-demo2 下,创建新的 metrics 包负责定义度量数据项,metrics 包的源码如下:
// tcp-server-demo2/metrics/metrics.go

package metrics

import (
    "fmt"
    "net/http"

    "github.com/prometheus/client_golang/prometheus"
    "github.com/prometheus/client_golang/prometheus/promhttp"
)

var (
    ClientConnected prometheus.Gauge
    ReqRecvTotal    prometheus.Counter
    RspSendTotal    prometheus.Counter
)

func init() {
    ReqRecvTotal = prometheus.NewCounter(prometheus.CounterOpts{
        Name: "tcp_server_demo2_req_recv_total",
    })
    RspSendTotal = prometheus.NewCounter(prometheus.CounterOpts{
        Name: "tcp_server_demo2_rsp_send_total",
    })

    ClientConnected = prometheus.NewGauge(prometheus.GaugeOpts{
        Name: "tcp_server_demo2_client_connected",
    })

    prometheus.MustRegister(ReqRecvTotal, RspSendTotal, ClientConnected)

    // start the metrics server
    metricsServer := &http.Server{
        Addr: fmt.Sprintf(":%d", metricsHTTPPort),
    }

    mu := http.NewServeMux()
    mu.Handle("/metrics", promhttp.Handler())
    metricsServer.Handler = mu
    go func() {
        err := metricsServer.ListenAndServe()
        if err != nil {
            fmt.Println("prometheus-exporter http server start failed:", err)
        }
    }()
    fmt.Println("metrics server start ok(*:8889)")
}
2
3
4
5
6
7
8
9
10
11
12
13
14
15
16
17
18
19
20
21
22
23
24
25
26
27
28
29
30
31
32
33
34
35
36
37
38
39
40
41
42
43
44
45
46
47
48
使用 prometheus 提供的 go client 包中的类型定义了三个度量数据项。
其中 ClientConnected 的类型为 prometheus.Gauge,Gauge 是对一个数值的即时测量值,它反映一个值的瞬时快照;
而 ReqRecvTotal 和 RspSendTotal 的类型都为 prometheus.Counter。Counter 顾名思义,就是一个计数器,可以累加,也可以减少。不过要想反映预期的每秒处理能力的指标,还需要将这两个计数器与 rate 函数一起使用。
在 metrics 包的 init 函数中启动了一个 http server,这个 server 监听 8889 端口,prometheus 配置文件中 tcp-server job 采集的目标地址就是这个 8889 端口。也就是说,Prometheus 定期从 8889 端口拉取度量数据项的值。
有了 metrics 包以及度量数据项后,还需要将度量数据项埋到服务端的处理流程中,对 main 包改造:
// tcp-server-demo2/cmd/server/main.go
func handleConn(c net.Conn) {
    metrics.ClientConnected.Inc() // 连接建立,ClientConnected加1
    defer func() {
        metrics.ClientConnected.Dec() // 连接断开,ClientConnected减1
        c.Close()
    }()
    frameCodec := frame.NewMyFrameCodec()

    for {
        // read from the connection

        // decode the frame to get the payload
        // the payload is undecoded packet
        framePayload, err := frameCodec.Decode(c)
        if err != nil {
            fmt.Println("handleConn: frame decode error:", err)
            return
        }
        metrics.ReqRecvTotal.Add(1) // 收到并解码一个消息请求,ReqRecvTotal消息计数器加1

        // do something with the packet
        ackFramePayload, err := handlePacket(framePayload)
        if err != nil {
            fmt.Println("handleConn: handle packet error:", err)
            return
        }

        // write ack frame to the connection
        err = frameCodec.Encode(c, ackFramePayload)
        if err != nil {
            fmt.Println("handleConn: frame encode error:", err)
            return
        }
        metrics.RspSendTotal.Add(1) // 返回响应后,RspSendTotal消息计数器减1
    }
}
2
3
4
5
6
7
8
9
10
11
12
13
14
15
16
17
18
19
20
21
22
23
24
25
26
27
28
29
30
31
32
33
34
35
36
37
在每个连接的处理主函数 handleConn 中都埋入了各个度量数据项,并在特定事件发生时修改度量数据的值。
服务端建立完度量数据项后,还需要在 Grafana 中建立对应的仪表板来展示这些度量数据项。手动创建仪表板 tcp-server-demo,并为仪表板手动建立三个 panel:req_recv_rate、rsp_send_rate 和 client_connected,如下图所示:

client_connected panel 比较简单,直接取 tcp_server_demo2_client_connected 这个注册到 prometheus 中的度量项的值就可以了。
而 req_recv_rate 和 rsp_send_rate 要结合度量项的值与 rate 函数 (opens new window) 实现。以 req_recv_rate 这个 panel 为例:
Metrics Browser 后面的表达式是:rate(tcp_server_demo2_req_recv_total[15s]),这个表达式返回的是在 15 秒内测得的 req_recv_total 的每秒速率,这恰恰是可以反映服务端处理性能的指标。

第一版性能基准
基于 tcp-server-demo1/cmd/client 实现压力测试客户端模拟器。
建立以及使用性能基准的前提,是服务端的压测的硬件条件要尽量保持一致,以保证得到的结果受外界干扰较少,性能基准才更有参考意义。
压测的步骤:首先在 tcp-server-demo2 下构建出 server 与 client 两个可执行程序。然后先启动 server,再启动 client。运行几分钟后,停掉程序就可以了。这时,在 grafana 的 tcp-server 的仪表板中,就能看到图形化数据展示:
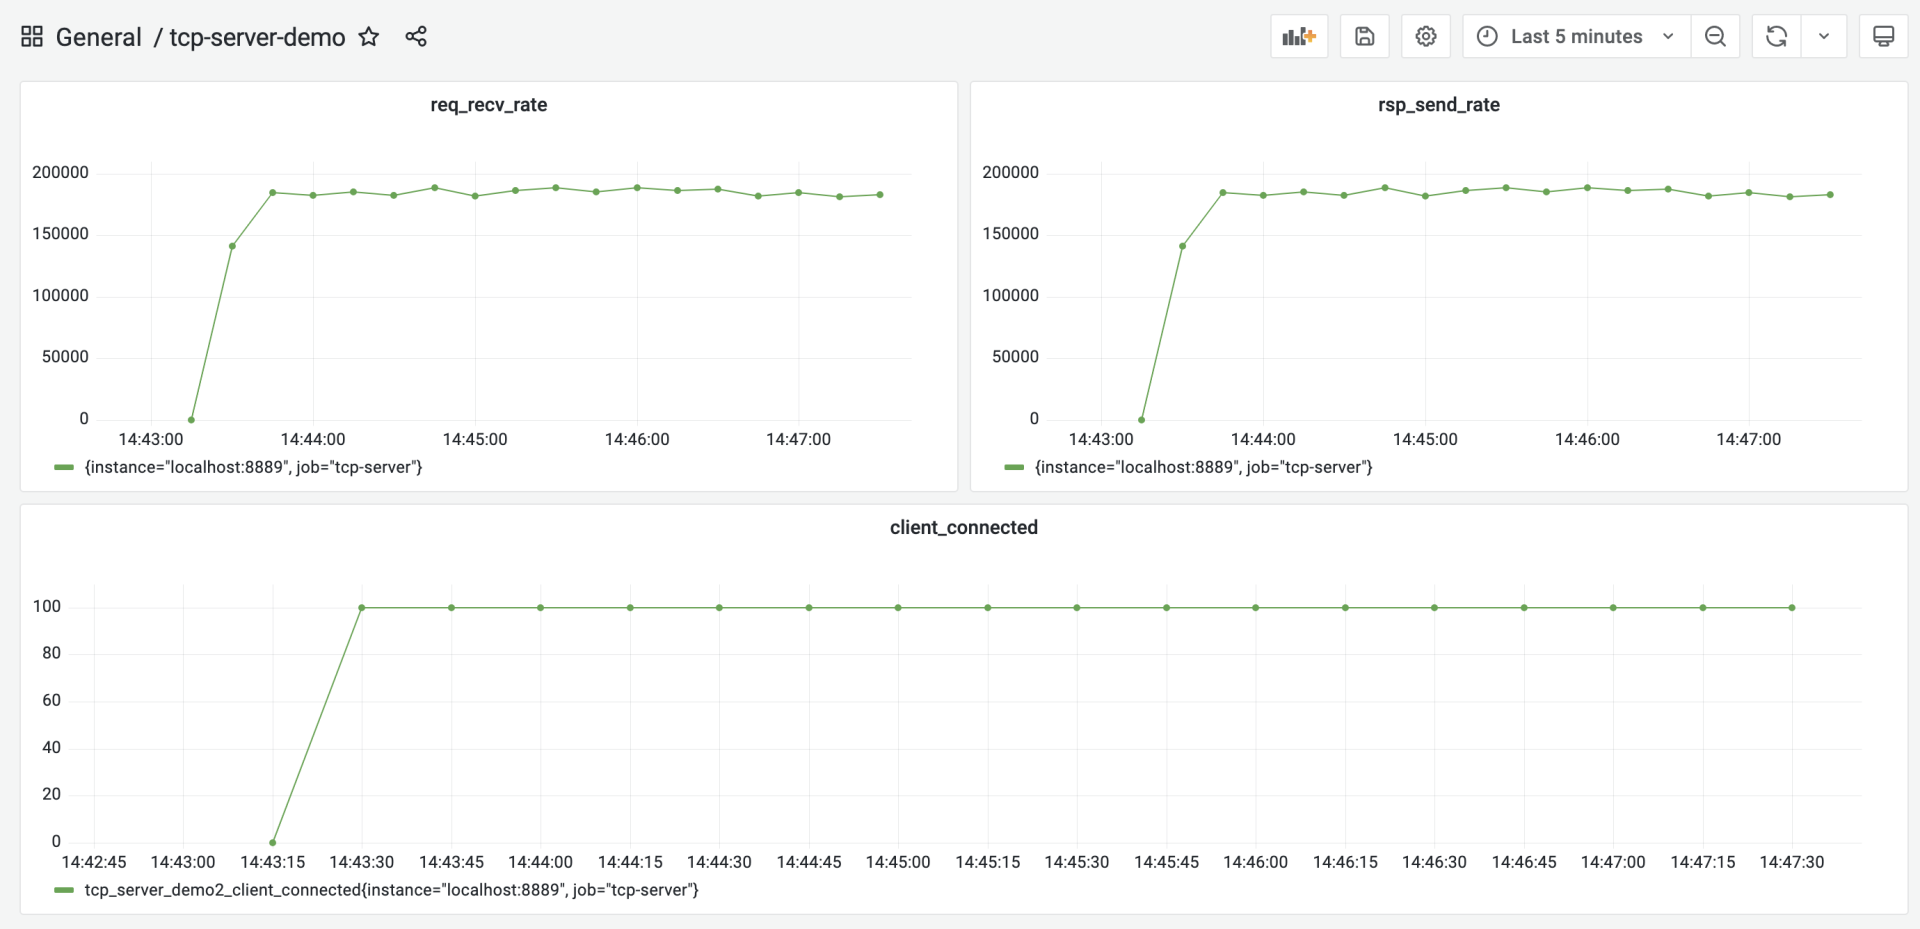
从这张图中,大约看到服务端的处理性能大约在 18.5w/ 秒左右,将这个结果作为服务端的第一个性能基准。
# 5.3 性能剖析
Go 代码进行性能剖析的工具:pprof
pprof 源自 Google Perf Tools 工具套件 (opens new window) ,在 Go 发布早期就被集成到 Go 工具链中,所以 pprof 也是 Gopher 最常用的、对 Go 应用进行性能剖析的工具。
Go 应用支持 pprof 性能剖析的方式有多种,最受 Gopher 青睐的是通过导入net/http/pprof包的方式。
改造 tcp-server-demo2,让它通过这种方式支持 pprof 性能剖析:
// tcp-server-demo2-with-pprof/cmd/server/main.go

import (
    ... ...
    "net/http"
    _ "net/http/pprof"
    ... ...
)

... ...

func main() {
    go func() {
        http.ListenAndServe(":6060", nil)
    }()
    ... ...
}
2
3
4
5
6
7
8
9
10
11
12
13
14
15
16
17
以空导入的方式导入 net/http/pprof 包,并在一个单独的 goroutine 中启动一个标准的 http 服务,就可以实现对 pprof 性能剖析的支持。pprof 工具可以通过 6060 端口采样到 Go 程序的运行时数据。
编译 tcp-server-demo2-with-pprof 目录下的 server 与 client,先后启动 server 与 client,让 client 对 server 保持持续的压力。
然后在自己的开发机上执行下面命令:
// 192.168.10.18为服务端的主机地址
$go tool pprof -http=:9090 http://192.168.10.18:6060/debug/pprof/profile
Fetching profile over HTTP from http://192.168.10.18:6060/debug/pprof/profile
Saved profile in /Users/tonybai/pprof/pprof.server.samples.cpu.004.pb.gz
Serving web UI on http://localhost:9090
2
3
4
5
go tool pprof 命令默认会从 http://192.168.10.18:6060/debug/pprof/profile 服务上,采集 CPU 类型的性能剖析数据,然后打开本地浏览器,默认显示如下页面:

debug/pprof/profile 提供的是 CPU 的性能采样数据。CPU 类型采样数据是性能剖析中最常见的采样数据类型。一旦启用 CPU 数据采样,Go 运行时会每隔一段短暂的时间(10ms)就中断一次(由 SIGPROF 信号引发),并记录当前所有 goroutine 的函数栈信息。它能帮助识别出代码关键路径上出现次数最多的函数,而往往这个函数就是程序的一个瓶颈。
沿着上图粗红线向下看,会看到以下信息:

看到图中间的 Syscall 函数占据了一个最大的方框,并用黑体标记了出来,这就是程序的第一个瓶颈:花费太多时间在系统调用上了。在向上寻找,发现 Syscall 的调用者基本都是网络 read 和 write 导致的。
# 5.4 代码优化
# 5.4.1 带缓存的网络 I/O
网络 read 和 write 导致大量 Syscall 的原因:
在 handleConn 函数中,直接将 net.Conn 实例传给 frame.Decode 作为 io.Reader 参数的实参,这样,每次调用 Read 方法都是直接从 net.Conn 中读取数据,而 Read 将转变为一次系统调用(Syscall),哪怕是仅仅读取一个字节也是如此。因此,优化目标是 降低 net.Conn 的 Write 和 Read 的频率。
降低 net.Conn 的读写频率方法:
增加缓存不失为一个有效的方法。而且服务端采用的是一个 goroutine 处理一个客户端连接的方式,由于没有竞态,这个模型更适合在读写 net.Conn 时使用带缓存的方式。
为 tcp-server-demo2 增加 net.Conn 的缓存读与缓存写。优化后的代码放在了 tcp-server-demo3 下:
// tcp-server-demo3/cmd/server/main.go

 func handleConn(c net.Conn) {
     metrics.ClientConnected.Inc()
     defer func() {
         metrics.ClientConnected.Dec()
         c.Close()
     }()
     frameCodec := frame.NewMyFrameCodec()
     rbuf := bufio.NewReader(c)
     wbuf := bufio.NewWriter(c)

     defer wbuf.Flush()
     for {
         // read from the connection

         // decode the frame to get the payload
         // the payload is undecoded packet
         framePayload, err := frameCodec.Decode(rbuf)
         if err != nil {
             fmt.Println("handleConn: frame decode error:", err)
             return
         }
         metrics.ReqRecvTotal.Add(1)

         // do something with the packet
         ackFramePayload, err := handlePacket(framePayload)
         if err != nil {
             fmt.Println("handleConn: handle packet error:", err)
             return
         }

         // write ack frame to the connection
         err = frameCodec.Encode(wbuf, ackFramePayload)
         if err != nil {
             fmt.Println("handleConn: frame encode error:", err)
             return
         }
         metrics.RspSendTotal.Add(1)
     }
 }
2
3
4
5
6
7
8
9
10
11
12
13
14
15
16
17
18
19
20
21
22
23
24
25
26
27
28
29
30
31
32
33
34
35
36
37
38
39
40
41
tcp-server-demo3 唯一的改动,就是 main 包中的 handleConn 函数。在这个函数中,新增了一个读缓存变量(rbuf)和一个写缓存变量(wbuf),用这两个变量替换掉传给 frameCodec.Decode 和 frameCodec.Encode 的 net.Conn 参数。
以 rbuf 为例,它起到降低 syscall 调用频率的作用。将 net.Conn 改为 rbuf 后,frameCodec.Decode 中的每次网络读取实际调用的都是 bufio.Reader 的 Read 方法。bufio.Reader.Read 方法内部,每次从 net.Conn 尝试读取其内部缓存大小的数据,而不是用户传入的希望读取的数据大小。这些数据缓存在内存中,这样,后续的 Read 就可以直接从内存中得到数据,而不是每次都要从 net.Conn 读取,从而降低 Syscall 调用的频率。
对优化后的 tcp-server-demo3 做一次压测,看看它的处理性能到底有没有提升,压测的步骤参考前面的内容。压测后,得到下面的结果:

从图中可以看到,优化后的服务端的处理性能提升到 27w/s 左右,相比于第一版性能基准 (18.5w/s),性能提升了足有 45%。
# 5.4.2 重用内存对象
带缓存的网络 I/O,是从 CPU 性能采样数据中找到的“瓶颈点”。在 Go 中还有另外一个十分重要的性能指标,那就是堆内存对象的分配。
Go 是带有垃圾回收(GC)的语言,频繁的堆内存对象分配或分配较多,都会给 GC 带去较大压力,而 GC 的压力显然会转化为对 CPU 资源的消耗,从而挤压处理正常业务逻辑的 goroutine 的 CPU 时间。
采集 tcp-server-demo2-with-pprof 目录下的 server 的内存分配采样数据,看是否有值得优化的点。这次直接使用 go tool pprof 的命令行采集与交互模式。在启动 server 和 client 后,手工执行下面命令进行内存分配采样数据的获取:
$ go tool pprof http://192.168.10.18:6060/debug/pprof/allocs
Fetching profile over HTTP from http://192.168.10.18:6060/debug/pprof/allocs
Saved profile in /root/pprof/pprof.server.alloc_objects.alloc_space.inuse_objects.inuse_space.001.pb.gz
File: server
Type: alloc_space
Time: Jan 23, 2022 at 6:05pm (CST)
Entering interactive mode (type "help" for commands, "o" for options)
2
3
4
5
6
7
数据获取到后,可以使用 go tool pprof 提供的命令行交互指令,来查看各个函数的堆内存对象的分配情况,其中最常用的一个指令就是 top,执行 top 后,得到如下结果:
(pprof) top
Showing nodes accounting for 119.27MB, 97.93% of 121.79MB total
Dropped 31 nodes (cum <= 0.61MB)
Showing top 10 nodes out of 30
      flat  flat%   sum%        cum   cum%
      38MB 31.20% 31.20%    43.50MB 35.72%  github.com/bigwhite/tcp-server-demo2/packet.Decode
   28.50MB 23.40% 54.61%    28.50MB 23.40%  github.com/bigwhite/tcp-server-demo2/frame.(*myFrameCodec).Decode
      18MB 14.78% 69.39%       79MB 64.87%  main.handlePacket
   17.50MB 14.37% 83.76%    17.50MB 14.37%  bytes.Join
       9MB  7.39% 91.15%        9MB  7.39%  encoding/binary.Write
    5.50MB  4.52% 95.66%     5.50MB  4.52%  github.com/bigwhite/tcp-server-demo2/packet.(*Submit).Decode (inline)
    1.76MB  1.45% 97.11%     1.76MB  1.45%  compress/flate.NewWriter
       1MB  0.82% 97.93%        1MB  0.82%  runtime.malg
         0     0% 97.93%     1.76MB  1.45%  bufio.(*Writer).Flush
         0     0% 97.93%     1.76MB  1.45%  compress/gzip.(*Writer).Write
2
3
4
5
6
7
8
9
10
11
12
13
14
15
top 命令的输出结果默认按 flat(flat%) 列从大到小的顺序输出。flat列的值在不同采样类型下表示的含义略有不同。
在 CPU 类型采样数据下,它表示函数自身代码在数据采样过程的执行时长;
在上面的堆内存分配类型采样数据下,它表示在采用过程中,某个函数中堆内存分配大小的和。而 flat% 列的值表示这个函数堆内存分配大小占堆内存总分配大小的比例。
从上面的输出结果来看,packet.Decode 函数排在第一位。那么,现在深入探究一下 Decode 函数中究竟哪一行代码分配的堆内存量最大。使用 list 命令可以进一步进入 Decode 函数的源码中查看:
(pprof) list packet.Decode
Total: 121.79MB
ROUTINE ======================== github.com/bigwhite/tcp-server-demo2/packet.Decode in /root/baim/tcp-server-demo2-with-pprof/packet/packet.go
      38MB    43.50MB (flat, cum) 35.72% of Total
         .          .     75:  case CommandConn:
         .          .     76:    return nil, nil
         .          .     77:  case CommandConnAck:
         .          .     78:    return nil, nil
         .          .     79:  case CommandSubmit:
      38MB       38MB     80:    s := Submit{}
         .     5.50MB     81:    err := s.Decode(pktBody)
         .          .     82:    if err != nil {
         .          .     83:      return nil, err
         .          .     84:    }
         .          .     85:    return &s, nil
         .          .     86:  case CommandSubmitAck:
(pprof)
2
3
4
5
6
7
8
9
10
11
12
13
14
15
16
17
s := Submit{}这一行是分配内存的“大户”,每次服务端收到一个客户端 submit 请求时,都会在堆上分配一块内存表示 Submit 类型的实例。
这个在程序关键路径上的堆内存对象分配会给 GC 带去压力,要尽量避免或减小它的分配频度,一个可行的办法是尽量重用内存对象。
在 Go 中,提到重用内存对象,就会想到了 sync.Pool。简单来说,sync.Pool 就是官方实现的一个可复用的内存对象池,使用 sync.Pool,可以减少堆对象分配的频度,进而降低给 GC 带去的压力。
在 tcp-server-demo3 的基础上,使用 sync.Pool 进行堆内存对象分配的优化,新版的代码放在了 tcp-server-demo3-with-syncpool 中,新版代码相对于 tcp-server-demo3 有两处改动:
第一处改动:
// tcp-server-demo3-with-syncpool/packet/packet.go
var SubmitPool = sync.Pool{
    New: func() interface{} {
        return &Submit{}
    },
}

func Decode(packet []byte) (Packet, error) {
    commandID := packet[0]
    pktBody := packet[1:]

    switch commandID {
    case CommandConn:
        return nil, nil
    case CommandConnAck:
        return nil, nil
    case CommandSubmit:
        s := SubmitPool.Get().(*Submit) // 从SubmitPool池中获取一个Submit内存对象
        err := s.Decode(pktBody)
        if err != nil {
            return nil, err
        }
        return s, nil
    case CommandSubmitAck:
        s := SubmitAck{}
        err := s.Decode(pktBody)
        if err != nil {
            return nil, err
        }
        return &s, nil
    default:
        return nil, fmt.Errorf("unknown commandID [%d]", commandID)
    }
}
2
3
4
5
6
7
8
9
10
11
12
13
14
15
16
17
18
19
20
21
22
23
24
25
26
27
28
29
30
31
32
33
34
第一处是在 packet.go 中,创建了一个 SubmitPool 变量,它的类型为 sync.Pool,这就是内存对象池,池中的对象都是 Submit。这样在 packet.Decode 中收到 Submit 类型请求时,也不需要新分配一个 Submit 对象,而是直接从 SubmitPool 代表的 Pool 池中取出一个复用。
第二处改动:
// tcp-server-demo3-with-syncpool/cmd/server/main.go

func handlePacket(framePayload []byte) (ackFramePayload []byte, err error) {
    var p packet.Packet
    p, err = packet.Decode(framePayload)
    if err != nil {
        fmt.Println("handleConn: packet decode error:", err)
        return
    }

    switch p.(type) {
    case *packet.Submit:
        submit := p.(*packet.Submit)
        submitAck := &packet.SubmitAck{
            ID:     submit.ID,
            Result: 0,
        }
        packet.SubmitPool.Put(submit) // 将submit对象归还给Pool池
        ackFramePayload, err = packet.Encode(submitAck)
        if err != nil {
            fmt.Println("handleConn: packet encode error:", err)
            return nil, err
        }
        return ackFramePayload, nil
    default:
        return nil, fmt.Errorf("unknown packet type")
    }
}
2
3
4
5
6
7
8
9
10
11
12
13
14
15
16
17
18
19
20
21
22
23
24
25
26
27
28
在 Submit 对象用完后,归还回 Pool 池,最理想的“归还地点”是在 main 包的 handlePacket 函数中,这里处理完 Submit 消息后,Submit 对象就没有什么用了,于是在这里将其归还给 Pool 池。
构建一下 tcp-server-demo3-with-syncpool 目录下的服务端,并使用客户端对其进行一次压测,压测几分钟后,就能看到如下的结果:

从采集的性能指标来看,优化后的服务端的处理能力平均可以达到 29.2w/s,这相比于上一次优化后的 27w/s,又小幅提升了 8% 左右。
至于是否要继续新一轮的优化,这就要看当前的性能是否能满足要求了。如果满足,就不需再进行新的优化,否则还需要继续一轮或几轮优化活动,直到性能满足要求为止。